
시스템 성능 엔지니어링 강독회 .
시스템 성능 엔지니어링 부록 .
1. USE 방법론: 리눅스 체크리스트 (p1073)
2. Pert Event : One Liner
3. State vs Status 차이점
1. 시스템 성능 엔지니어링 강독회
- 일정 : 2025년 12월5일, 12일, 17일 (3회자)
- 장소 : 뚝섬역 5번 출구 튜링의 사과 스타벅스 옆 흰색 빌딩 건물(밀크 빌딩) 지하 1층
- 시간 : 저녁 7:00 - 9:00
- 후원 : 인사이트 출판사
- 진행 : 한국 리눅스 사용자 그룹
- 저자 블로그: 브렌던 그레그 블로그
- 강독회를 위한 저자 이메일:
G'Day Tommy,

Sorry for the long delay; I finally have time to catch up on all my flagged email now
I'm winding down my Intel job. I've CC'd my personal address as this Intel address
will no longer work soon.

I'm glad to hear it's translated to Korean, and thanks for planning to do a study seminar.
I'm not sure what to say as words of encouragement: It's still a very popular book,
and I wrote a lot of the content to be durable and not become out of date quickly.
It's also highly recommended to new engineers at various companies including Meta.

Brendan
2. 시스템 성능 엔지니어링 강독 범위
- 1회차 : 1장 소개 /2장 방법론
- 2회차 : 4장 관측가능성 도구 / 5장 어플리케이션
- 3회차 : 이호연님 세션 및 네트워킹 시간
- 4.세션 슬라이드
1. USE 방법론: 리눅스
USE Method:Linux Check List Brendan Gregg
- USE 방법은 시스템 상태를 완벽하게 점검하고 일반적인 병목 현상과 오류를 식별하는 전략을 제공합니다.
- 각 시스템 리소스에 대해 사용률, 포화도 및 오류 관련 지표를 식별하고 점검합니다. 발견된 문제는 추가적인 전략을 사용하여 조사합니다.
- 다음은 Linux 운영 체제(예: Ubuntu, CentOS, Fedora, Rocky Linux)에서 사용할 수 있는 USE 기반 지표 목록의 예입니다.
- 이 목록은 주로 명령줄 도구를 사용하는 물리적 시스템 관리자를 위해 작성되었습니다. 이러한 지표 중 일부는 원격 모니터링 도구에서도 확인할 수 있습니다.
[1] CPU 사용률 관련
- 가상화 환경에서는 top이나 htop에서 보여주는 %CPU 값이 이상하게 보이는 경우가 종종 있습니다. CPU 사용률에서 특정 CPU 하나만 과도하게 바쁘게 보이는 경우는,하나의 핫 스레드(single hot thread) 때문이거나특정 하드웨어 인터럽트가 한 CPU에 매핑되어 있기 때문일 수 있습니다. 이런 병목을 완화하려면, 보통 작업을 더 많은 CPU에서 병렬로 처리하도록 튜닝하는 방식이 필요합니다.
- uptime 명령의 load average(또는 /proc/loadavg)는 CPU 지표에 포함하지 않았는데, 이유는 리눅스의 load average가 CPU를 기다리는 작업뿐만 아니라, 인터럽트 불가능 상태(uninterruptible state, 보통 I/O 대기) 에 있는 작업도 포함하기 때문입니다.
[2] vmstat의 r 값에 대한 주의점
- vmstat의 man 페이지에서는 r을 “실행 시간을 기다리는 프로세스의 수” 라고 설명하고 있지만, 이는 부정확하거나 오해를 부를 수 있는 설명입니다. 최근 리눅스 배포판에서는 r 값이 CPU에서 실제로 실행 중인 스레드 실행을 기다리는 스레드 를 모두 포함합니다.다른 운영체제에서는 보통 “대기 중인 스레드만” 의미하는 경우가 많아, 비교 시 주의가 필요합니다
[3] 프로세스별 스케줄링 지연(latency) 측정
- perf의 sched:sched_process_wait 이벤트를 사용하면 프로세스 단위의 스케줄링 지연 시간을 측정할 수 있을 가능성이 있습니다. 또는 perf probe를 이용해 스케줄러 함수들을 동적으로 트레이싱할 수도 있습니다.
- 다만, 시스템 부하가 높은 상황에서는 초당 수십만 개 이상의 이벤트가 발생할 수 있고 이를 수집·후처리하는 오버헤드가 매우 커질 수 있어 현실적으로 어려울 수 있습니다.
- SystemTap은 커널 내부에서 스레드별 지연 시간을 집계(aggregate) 할 수 있어 오버헤드를 줄일 수 있지만, 예전에 schedtimes.stp 스크립트(Fedora Core 16 기준)를 사용했을 때는 “unknown transition” 경고가 수천 개씩 출력되는 문제가 있었습니다.
LPE / CPC 용어 설명
LPE (Linux Performance Events)
- 흔히 perf_events라고 불리며, 리눅스의 강력한 관측(Observability) 도구입니다. CPU 성능 카운터(CPC)를 읽을 수 있고, 정적/동적 트레이싱도 지원합니다. 사용자 인터페이스는 perf 명령어입니다.
CPC (CPU Performance Counters)
- 다음과 같은 이름으로도 불립니다:
PICs (Performance Instrumentation Counters)
PMCs (Performance Monitoring Counters)
PMU (Performance Monitoring Unit) 이벤트
- 이는 각 CPU에 있는 프로그래머블 레지스터를 통해 읽는 하드웨어 이벤트이며, perf는 원래 이를 읽기 위해 설계되었습니다. CPU 종류마다 이벤트가 달라 전통적으로 다루기 어려웠지만,perf는 자주 쓰는 이벤트에 대해 별칭(alias) 을 제공해 사용을 쉽게 해줍니다.
- 단, CPU에는 문서에 나온 것보다 훨씬 많은 이벤트가 있으며,이들은 perf stat -e [hex 값] 형태로 접근할 수 있습니다. 이런 작업을 제대로 하려면 CPU 제조사 매뉴얼을 며칠씩 파고들 각오가 필요합니다.
[4] 오류 관련 이벤트의 한계
- 최신 Intel 및 AMD CPU 매뉴얼에는 에러 관련 성능 이벤트가 많지 않습니다.
- 또한 공개된 매뉴얼에 모든 이벤트가 다 나와 있지 않을 가능성도 염두에 두어야 합니다.
[5] 메모리 포화(saturation) 측정
- 목표는 메모리 용량이 얼마나 포화 상태인지,즉 특정 프로세스가 시스템의 한계를 넘어 paging / swapping을 유발하는 정도를 측정하는 것입니다.페이지 폴트 지연 시간(fault latency) 은 매우 좋은 지표이지만,이를 바로 쓸 수 있는 표준 LPE probe나 기존 SystemTap 예제는 존재하지 않습니다.
- 동적 트레이싱으로 직접 만들어야 합니다. 대안으로는 프로세스별 minor fault 발생률을 사용할 수 있습니다. /proc/PID/stat에서 확인 가능 htop에서는 MINFLT 항목으로 볼 수 있습니다.
[6] 네트워크 도구 nicstat
- Tim Cook이 nicstat을 리눅스로 포팅했습니다.
- SourceForge나 그의 블로그에서 구할 수 있습니다.
[7] 패킷 드롭(dropped packets)
- 패킷 드롭은 자원 포화(saturation) 때문에 발생할 수도 있고
- 에러(error) 때문에 발생할 수도 있기 때문에 두 가지 지표 모두에 포함시켜 해석해야 합니다.
[8] I/O 서브시스템 트레이싱
- 이는 다양한 I/O 계층의 함수들을 트레이싱하는 것을 포함합니다:
- 블록 디바이스: SCSI, SATA, IDE 등
- 일부 정적 트레이스 포인트는 이미 제공됩니다: LPE의 scsi, block tracepoint 이벤트 그렇지 않은 경우에는 동적 트레이싱을 사용해야 합니다.
추가 용어 정리
CPI (Cycles Per Instruction)
- 명령어 하나를 실행하는 데 필요한 CPU 사이클 수 (반대로 IPC: Instructions Per Cycle 를 쓰는 경우도 많음)
I/O 인터커넥트
- CPU ↔ I/O 컨트롤러 간 버스
- I/O 컨트롤러 자체
- 디바이스 버스 (예: PCIe) 전체를 포함
동적 트레이싱 (Dynamic Tracing)
- 운영 중인 실제 프로덕션 환경에서 커스텀 메트릭을 실시간으로 개발·수집할 수 있는 기법
리눅스에서의 선택지는 다음과 같습니다:
- perf probe : 기본적인 함수 진입 및 변수 트레이싱 가능
- trace-and-dump : 방식이라 성능 비용이 클 수 있음
- SystemTap : CentOS/Ubuntu에서는 불안정한 경우가 많았고 Fedora에서는 상대적으로 안정적이었음
- DTrace for Linux Paul Fox 포트
- Oracle Enterprise Linux(OEL) 포트 : 둘 다 아직 베타 단계 수준
2. Perf Event : One-Liner
- 아래는 저자가 오버헤드가 낮은 것부터 높은 것 순서로 정리한 용어입니다.
-
사용 중인 용어는 오버헤드가 낮은 순서부터 높은 순서대로 다음과 같습니다.
statistics/count: 이벤트 발생 시 정수 카운터를 증가시킵니다.
sample: 일부 이벤트(예: 명령어 포인터 또는 스택)에서 세부 정보를 수집합니다(매번 …마다).
trace: 모든 이벤트에서 세부 정보를 수집합니다. -
이 한 줄짜리 코드들은 perf_events의 기능을 보여주는 예시이며, 간단한 학습 자료로도 활용할 수 있습니다. 이 코드들을 인쇄하여 perf_events 요약본으로 사용할 수도 있습니다.
- Listing Events
# Listing all currently known events::
perf list
# Listing sched tracepoints:
perf list 'sched:*'
- Counting Events
stics for the specified command:
perf stat command

# Detailed CPU counter statistics (includes extras) for the specified command:
perf stat -d command

# CPU counter statistics for the specified PID, until Ctrl-C:
perf stat -p PID

# CPU counter statistics for the entire system, for 5 seconds:
perf stat -a sleep 5

# Various basic CPU statistics, system wide, for 10 seconds:
perf stat -e cycles,instructions,cache-references,cache-misses,bus-cycles -a sleep 10

# Various CPU level 1 data cache statistics for the specified command:
perf stat -e L1-dcache-loads,L1-dcache-load-misses,L1-dcache-stores command

# Various CPU data TLB statistics for the specified command:
perf stat -e dTLB-loads,dTLB-load-misses,dTLB-prefetch-misses command

# Various CPU last level cache statistics for the specified command:
perf stat -e LLC-loads,LLC-load-misses,LLC-stores,LLC-prefetches command

# Using raw PMC counters, eg, counting unhalted core cycles:
perf stat -e r003c -a sleep 5

# PMCs: counting cycles and frontend stalls via raw specification:
perf stat -e cycles -e cpu/event=0x0e,umask=0x01,inv,cmask=0x01/ -a sleep 5

# Count syscalls per-second system-wide:
perf stat -e raw_syscalls:sys_enter -I 1000 -a

# Count system calls by type for the specified PID, until Ctrl-C:
perf stat -e 'syscalls:sys_enter_*' -p PID

# Count system calls by type for the entire system, for 5 seconds:
perf stat -e 'syscalls:sys_enter_*' -a sleep 5

# Count scheduler events for the specified PID, until Ctrl-C:
perf stat -e 'sched:*' -p PID

# Count scheduler events for the specified PID, for 10 seconds:
perf stat -e 'sched:*' -p PID sleep 10

# Count ext4 events for the entire system, for 10 seconds:
perf stat -e 'ext4:*' -a sleep 10

# Count block device I/O events for the entire system, for 10 seconds:
perf stat -e 'block:*' -a sleep 10

# Count all vmscan events, printing a report every second:
perf stat -e 'vmscan:*' -a -I 1000
- Profiling
# Sample on-CPU functions for the specified command, at 99 Hertz:
perf record -F 99 command

# Sample on-CPU functions for the specified PID, at 99 Hertz, until Ctrl-C:
perf record -F 99 -p PID

# Sample on-CPU functions for the specified PID, at 99 Hertz, for 10 seconds:
perf record -F 99 -p PID sleep 10

# Sample CPU stack traces (via frame pointers) for the specified PID, at 99 Hertz, for 10 seconds:
perf record -F 99 -p PID -g -- sleep 10

# Sample CPU stack traces for the PID, using dwarf (dbg info) to unwind stacks, at 99 Hertz, for 10 seconds:
perf record -F 99 -p PID --call-graph dwarf sleep 10

# Sample CPU stack traces for the entire system, at 99 Hertz, for 10 seconds (< Linux 4.11):
perf record -F 99 -ag -- sleep 10

# Sample CPU stack traces for the entire system, at 99 Hertz, for 10 seconds (>= Linux 4.11):
perf record -F 99 -g -- sleep 10

# If the previous command didn't work, try forcing perf to use the cpu-clock event:
perf record -F 99 -e cpu-clock -ag -- sleep 10

# Sample CPU stack traces for a container identified by its /sys/fs/cgroup/perf_event cgroup:
perf record -F 99 -e cpu-clock --cgroup=docker/1d567f4393190204...etc... -a -- sleep 10

# Sample CPU stack traces for the entire system, with dwarf stacks, at 99 Hertz, for 10 seconds:
perf record -F 99 -a --call-graph dwarf sleep 10

# Sample CPU stack traces for the entire system, using last branch record for stacks, ... (>= Linux 4.?):
perf record -F 99 -a --call-graph lbr sleep 10

# Sample CPU stack traces, once every 10,000 Level 1 data cache misses, for 5 seconds:
perf record -e L1-dcache-load-misses -c 10000 -ag -- sleep 5

# Sample CPU stack traces, once every 100 last level cache misses, for 5 seconds:
perf record -e LLC-load-misses -c 100 -ag -- sleep 5

# Sample on-CPU kernel instructions, for 5 seconds:
perf record -e cycles:k -a -- sleep 5

# Sample on-CPU user instructions, for 5 seconds:
perf record -e cycles:u -a -- sleep 5

# Sample on-CPU user instructions precisely (using PEBS), for 5 seconds:
perf record -e cycles:up -a -- sleep 5

# Perform branch tracing (needs HW support), for 1 second:
perf record -b -a sleep 1

# Sample CPUs at 49 Hertz, and show top addresses and symbols, live (no perf.data file):
perf top -F 49

# Sample CPUs at 49 Hertz, and show top process names and segments, live:
perf top -F 49 -ns comm,dso
- Static Tracing
# Trace new processes, until Ctrl-C:
perf record -e sched:sched_process_exec -a

# Sample (take a subset of) context-switches, until Ctrl-C:
perf record -e context-switches -a

# Trace all context-switches, until Ctrl-C:
perf record -e context-switches -c 1 -a

# Include raw settings used (see: man perf_event_open):
perf record -vv -e context-switches -a

# Trace all context-switches via sched tracepoint, until Ctrl-C:
perf record -e sched:sched_switch -a

# Sample context-switches with stack traces, until Ctrl-C:
perf record -e context-switches -ag

# Sample context-switches with stack traces, for 10 seconds:
perf record -e context-switches -ag -- sleep 10

# Sample CS, stack traces, and with timestamps (< Linux 3.17, -T now default):
perf record -e context-switches -ag -T

# Sample CPU migrations, for 10 seconds:
perf record -e migrations -a -- sleep 10

# Trace all connect()s with stack traces (outbound connections), until Ctrl-C:
perf record -e syscalls:sys_enter_connect -ag

# Trace all accepts()s with stack traces (inbound connections), until Ctrl-C:
perf record -e syscalls:sys_enter_accept* -ag

# Trace all block device (disk I/O) requests with stack traces, until Ctrl-C:
perf record -e block:block_rq_insert -ag

# Sample at most 100 block device requests per second, until Ctrl-C:
perf record -F 100 -e block:block_rq_insert -a

# Trace all block device issues and completions (has timestamps), until Ctrl-C:
perf record -e block:block_rq_issue -e block:block_rq_complete -a

# Trace all block completions, of size at least 100 Kbytes, until Ctrl-C:
perf record -e block:block_rq_complete --filter 'nr_sector > 200'

# Trace all block completions, synchronous writes only, until Ctrl-C:
perf record -e block:block_rq_complete --filter 'rwbs == "WS"'

# Trace all block completions, all types of writes, until Ctrl-C:
perf record -e block:block_rq_complete --filter 'rwbs ~ "*W*"'

# Sample minor faults (RSS growth) with stack traces, until Ctrl-C:
perf record -e minor-faults -ag

# Trace all minor faults with stack traces, until Ctrl-C:
perf record -e minor-faults -c 1 -ag

# Sample page faults with stack traces, until Ctrl-C:
perf record -e page-faults -ag

# Trace all ext4 calls, and write to a non-ext4 location, until Ctrl-C:
perf record -e 'ext4:*' -o /tmp/perf.data -a

# Trace kswapd wakeup events, until Ctrl-C:
perf record -e vmscan:mm_vmscan_wakeup_kswapd -ag

# Add Node.js USDT probes (Linux 4.10+):
perf buildid-cache --add `which node`

# Trace the node http__server__request USDT event (Linux 4.10+):
perf record -e sdt_node:http__server__request -a
- Dynamic Tracing
# Add a tracepoint for the kernel tcp_sendmsg() function entry ("--add" is optional):
perf probe --add tcp_sendmsg

# Remove the tcp_sendmsg() tracepoint (or use "--del"):
perf probe -d tcp_sendmsg

# Add a tracepoint for the kernel tcp_sendmsg() function return:
perf probe 'tcp_sendmsg%return'

# Show available variables for the kernel tcp_sendmsg() function (needs debuginfo):
perf probe -V tcp_sendmsg

# Show available variables for the kernel tcp_sendmsg() function, plus external vars (needs debuginfo):
perf probe -V tcp_sendmsg --externs

# Show available line probes for tcp_sendmsg() (needs debuginfo):
perf probe -L tcp_sendmsg

# Show available variables for tcp_sendmsg() at line number 81 (needs debuginfo):
perf probe -V tcp_sendmsg:81

# Add a tracepoint for tcp_sendmsg(), with three entry argument registers (platform specific):
perf probe 'tcp_sendmsg %ax %dx %cx'

# Add a tracepoint for tcp_sendmsg(), with an alias ("bytes") for the %cx register (platform specific):
perf probe 'tcp_sendmsg bytes=%cx'

# Trace previously created probe when the bytes (alias) variable is greater than 100:
perf record -e probe:tcp_sendmsg --filter 'bytes > 100'

# Add a tracepoint for tcp_sendmsg() return, and capture the return value:
perf probe 'tcp_sendmsg%return $retval'

# Add a tracepoint for tcp_sendmsg(), and "size" entry argument (reliable, but needs debuginfo):
perf probe 'tcp_sendmsg size'

# Add a tracepoint for tcp_sendmsg(), with size and socket state (needs debuginfo):
perf probe 'tcp_sendmsg size sk->__sk_common.skc_state'

# Tell me how on Earth you would do this, but don't actually do it (needs debuginfo):
perf probe -nv 'tcp_sendmsg size sk->__sk_common.skc_state'

# Trace previous probe when size is non-zero, and state is not TCP_ESTABLISHED(1) (needs debuginfo):
perf record -e probe:tcp_sendmsg --filter 'size > 0 && skc_state != 1' -a

# Add a tracepoint for tcp_sendmsg() line 81 with local variable seglen (needs debuginfo):
perf probe 'tcp_sendmsg:81 seglen'

# Add a tracepoint for do_sys_open() with the filename as a string (needs debuginfo):
perf probe 'do_sys_open filename:string'

# Add a tracepoint for myfunc() return, and include the retval as a string:
perf probe 'myfunc%return +0($retval):string'

# Add a tracepoint for the user-level malloc() function from libc:
perf probe -x /lib64/libc.so.6 malloc

# Add a tracepoint for this user-level static probe (USDT, aka SDT event):
perf probe -x /usr/lib64/libpthread-2.24.so %sdt_libpthread:mutex_entry

# List currently available dynamic probes:
perf probe -l
- Mixed
# Trace system calls by process, showing a summary refreshing every 2 seconds:
perf top -e raw_syscalls:sys_enter -ns comm

# Trace sent network packets by on-CPU process, rolling output (no clear):
stdbuf -oL perf top -e net:net_dev_xmit -ns comm | strings

# Sample stacks at 99 Hertz, and, context switches:
perf record -F99 -e cpu-clock -e cs -a -g

# Sample stacks to 2 levels deep, and, context switch stacks to 5 levels (needs 4.8):
perf record -F99 -e cpu-clock/max-stack=2/ -e cs/max-stack=5/ -a -g
- Special
# Record cacheline events (Linux 4.10+):
perf c2c record -a -- sleep 10

# Report cacheline events from previous recording (Linux 4.10+):
perf c2c report
- Reporting
# Show perf.data in an ncurses browser (TUI) if possible:
perf report

# Show perf.data with a column for sample count:
perf report -n

# Show perf.data as a text report, with data coalesced and percentages:
perf report --stdio

# Report, with stacks in folded format: one line per stack (needs 4.4):
perf report --stdio -n -g folded

# List all events from perf.data:
perf script

# List all perf.data events, with data header (newer kernels; was previously default):
perf script --header

# List all perf.data events, with customized fields (< Linux 4.1):
perf script -f time,event,trace

# List all perf.data events, with customized fields (>= Linux 4.1):
perf script -F time,event,trace

# List all perf.data events, with my recommended fields (needs record -a; newer kernels):
perf script --header -F comm,pid,tid,cpu,time,event,ip,sym,dso

# List all perf.data events, with my recommended fields (needs record -a; older kernels):
perf script -f comm,pid,tid,cpu,time,event,ip,sym,dso

# Dump raw contents from perf.data as hex (for debugging):
perf script -D

# Disassemble and annotate instructions with percentages (needs some debuginfo):
perf annotate --stdio
3. State vs Status의 차이점
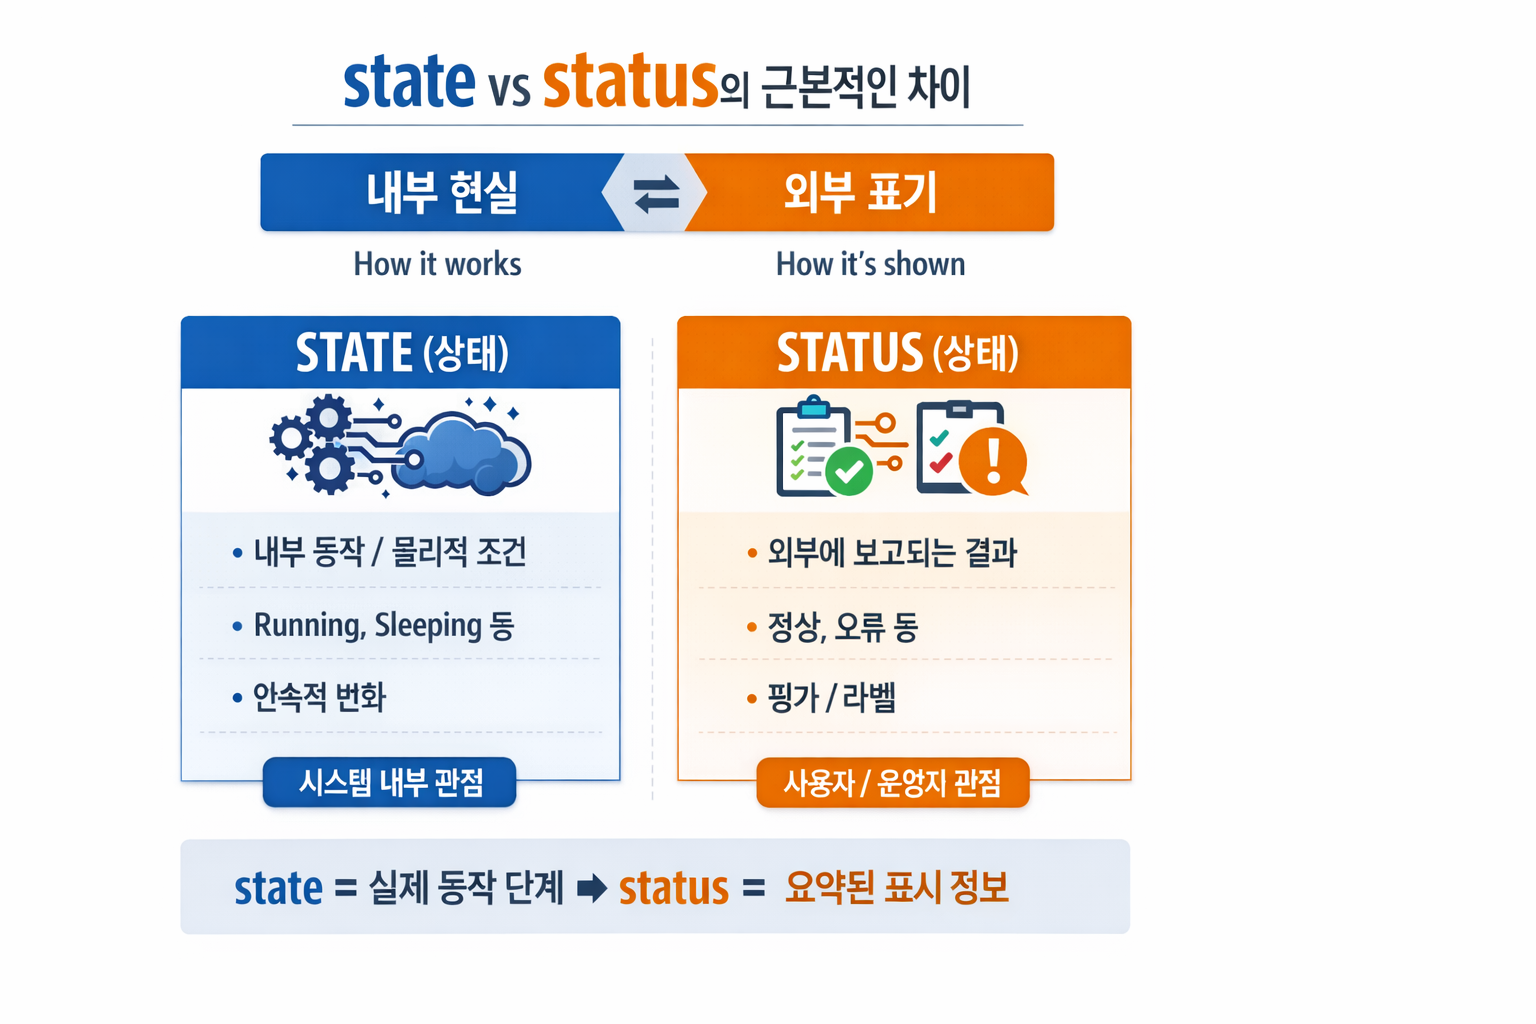
1. Status (상태, 가용성, 서비스 레벨)
성능 엔지니어링에서 Status는 주로 시스템 또는 서비스의 외부에 공개되는 가용성 및 건강성 지표를 의미합니다. 이는 사용자나 다른 시스템이 해당 서비스가 현재 사용 가능한지, 정상적으로 작동하고 있는지, 아니면 문제가 있는지 파악하는 데 사용됩니다.
- 외부 지향적: 사용자나 클라이언트의 관점에서 시스템의 현재 상태를 나타냅니다.
- 서비스 레벨: 서비스가 현재 제공되고 있는지, SLA(Service Level Agreement)를 만족하는지 여부와 관련이 깊습니다.
측정 지표:
- Up/Down (정상/비정상): 서비스가 현재 가동 중인지 아닌지.
- Healthy/Unhealthy: 서비스가 정상적인 트래픽을 처리할 준비가 되었는지. 헬스 체크(Health Check) 결과를 통해 결정됩니다.
- Degraded (성능 저하): 서비스는 가동 중이지만, 성능 저하로 인해 사용자 경험에 영향을 미치는 경우.
- Maintenance (점검 중): 의도적으로 서비스를 중단하고 유지보수 중인 경우.
예시 (Example):
- 웹사이트 Status 페이지: “모든 시스템 정상 작동 중”, “일부 서비스 중단”.
- 로드 밸런서의 Target Group: Status: 특정 서버 인스턴스가 트래픽을 받을 준비가 되었는지 여부.
- CI/CD 파이프라인 Status: 빌드 성공, 테스트 실패, 배포 대기 중 등.
2. State (내부 상태, 데이터 일관성, 자원 현황)
반면 State는 시스템 구성 요소의 현재 내부적인 조건, 데이터의 내용, 또는 자원의 할당 현황을 의미합니다. 이는 시스템 내부의 동작 방식과 직접적으로 관련되며, 특정 시점에서 시스템이 어떤 정보를 가지고 어떤 상태로 동작하고 있는지를 나타냅니다. 성능 엔지니어는 State를 분석하여 시스템의 병목 현상, 비효율적인 자원 사용, 또는 데이터 불일치 문제 를 진단합니다.
- 내부 지향적: 시스템 구성 요소 자체의 내부적인 조건과 데이터를 나타냅니다.
- 동작 및 효율성: 시스템의 내부 로직, 데이터 처리, 자원 관리에 깊이 관여합니다.
측정 지표:
- CPU 사용률, 메모리 사용량, 디스크 I/O: 자원 할당 및 사용 현황.
- 큐 길이, 스레드 풀 크기, 연결 수: 처리 대기 중인 작업량 및 동시성 상태.
- 데이터베이스 트랜잭션 State: 커밋 대기, 롤백 중 등.
- 애플리케이션 변수 State: 특정 변수의 현재 값, 세션 데이터.
- 네트워크 연결 State: ESTABLISHED, TIME_WAIT 등.
예시 (Example):
- 데이터베이스 연결 풀의 active_connections 수.
- 애플리케이션 서버의 heap_memory_usage (힙 메모리 사용량).
- Kafka 컨슈머 그룹의 lag (처리되지 않은 메시지 수).
- 프로세스의 runnable 또는 waiting State.
성능 엔지니어링에서의 활용
- Status 모니터링: 시스템의 전반적인 가용성과 건강성을 대시보드를 통해 실시간으로 확인하고, 문제가 발생하면 즉시 알림을 받습니다. 이는 서비스 중단 시간을 최소화하고 사용자 경험을 보호하는 데 중요합니다.
- State 분석: 특정 Status (예: Degraded)가 감지되었을 때, 관련 구성 요소들의 State를 깊이 분석하여 문제의 근본 원인을 파악합니다. 예를 들어, 웹서비스의 Status가 ‘Degraded’로 변경되면, 각 서버 인스턴스의 CPU State, 메모리 State, DB 연결 State 등을 확인하여 병목 지점을 찾아냅니다.
- 최적화: 시스템의 State 데이터를 분석하여 자원 할당을 최적화하고, 코드나 아키텍처를 개선하여 성능을 향상시킵니다. 예를 들어, 특정 큐의 길이가 지속적으로 길어지는 State를 발견하면, 해당 큐를 처리하는 워커 수를 늘리거나 처리 로직을 최적화할 수 있습니다.
- 결론적으로, Status는 “시스템이 사용자에게 어떻게 보이는가?”에 가깝고, State는 “시스템 내부가 현재 어떻게 동작하고 있는가?” 에 가깝습니다. 성능 엔지니어는 이 두 가지를 모두 이해하고 활용하여 시스템의 안정성과 효율성을 극대화합니다.